Connect your repos
Install the VS Code or Cursor extension. DevClocked finds your active repos automatically.
GitHub & Git analytics
Commit counts lie. See the real story: session duration, focus time, context switches, and contribution patterns across every repo.
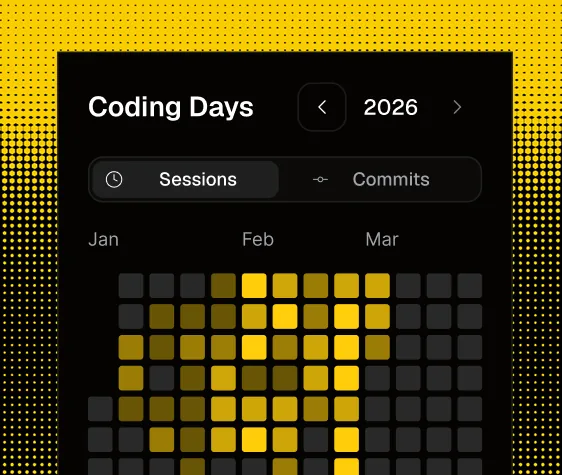
The problem
A 10-minute typo fix and an 8-hour architecture rewrite both show as one green square. Engineering managers draw wrong conclusions. Freelancers can't prove their actual effort to clients. Your git log tells you what changed, not how long it took or how deep the work was.
Install the VS Code or Cursor extension. DevClocked finds your active repos automatically.
No timers, no buttons. DevClocked tracks duration, idle gaps, and active coding time on its own.
Hours per repo, focus windows, and language breakdown. The insight a contribution graph can’t show.
Deep filtering
Don't get lost in the noise. Drill into specific projects, repositories, or individual branches. View sessions by day or dive into hour-by-hour velocity. See exactly where the complexity lives.
Activity classification
DevClocked classifies your coding sessions so you can understand your evolution as an engineer, not just your output.
Architecture decisions, design docs, and technical planning sessions.
New feature implementation, writing production code, shipping.
Issue resolution, stack traces, reproduction steps, patching.
Code cleanup, performance optimization, tech debt reduction.
Comparison
Everything you need to know about DevClocked
GitHub Insights shows commit frequency and lines changed. DevClocked adds the time dimension, how long sessions lasted, where you focused, idle gaps, and multi-tool activity (IDE + browser + terminal). It's the difference between knowing you made 12 commits and knowing you spent 7 hours of deep work across 3 repos.
No. DevClocked tracks metadata, file names, languages, session timestamps, and commit messages. It never reads, stores, or transmits your actual source code. Your code stays on your machine.
Yes. DevClocked tracks activity at the IDE and file system level, not through the GitHub API. Private repos are tracked the same way as public ones, through your editor activity.
It doesn't rely on git alone. DevClocked uses real-time signals from your IDE (file opens, saves, focus events) combined with commit metadata to build an accurate session timeline. Git data enriches the picture, it doesn't define it.
Own your output
Get the metrics that actually reflect your engineering effort. Free 7-day trial. No card needed.
Start Tracking FreeYour real output, measured at the source, not approximated from the commit graph.